Multi-objective optimization and Pareto frontiers
Optimize one number and you overfit to that number. The strategy you can actually live with is almost never “best Sharpe.” It is the one that is good enough on several things at once. The Pareto frontier is how you see that trade-off instead of guessing at it.
The single-objective trap
Give an optimizer one metric, and it maximizes that metric at the expense of everything you did not mention. Ask for best Sharpe and you receive brilliant Sharpe attached to an ugly drawdown, or a brilliant Sharpe on twelve trades, or a brilliant Sharpe earned in one lucky quarter.
The optimizer did nothing wrong. It answered the question you asked. The problem is that the question was wrong. You do not want the best Sharpe. You want good Sharpe that you can hold through its drawdowns, on enough trades to mean something, spread across time. Most spectacular single-metric backtests fail live for exactly this reason. The metric was achieved. The strategy was not. See statistical tools for what each number ignores while it is being maximized.
What multi-objective does
Give the optimizer two or three goals instead. Maximize Sharpe. Minimize drawdown. Keep the trade count above a floor. These goals conflict, and the conflict is the point. The configuration with the best Sharpe is rarely the one with the smallest drawdown.
Because they conflict, there is no single best answer. The output is a set of configurations, each a different balance. The choice among them becomes a decision you make with the trade-off in front of you. Before, the optimizer made that choice for you, silently, and its choice was always “sacrifice everything unmentioned.”
The frontier
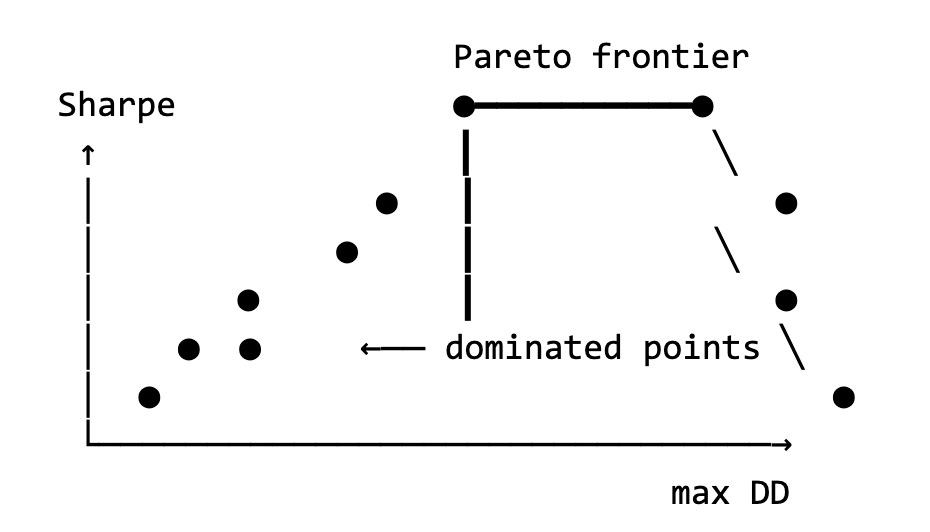
A configuration is Pareto-optimal when you cannot improve it on one goal without paying on another. The Pareto frontier is all such configurations. Everything off the frontier is dominated: something on the frontier beats it everywhere at once, so nothing off the frontier is ever worth choosing.
On a two-axis plot, Sharpe against drawdown, the frontier is the boundary of the possible:
How to read it
Four rules turn the picture into a decision.
The endpoints are usually wrong. The maximum-Sharpe end carries the ugly drawdown. The minimum-drawdown end barely trades. The endpoints are where single-objective optimization would have dumped you. The frontier exists so you can do better than its ends.
The middle is where the money is. Look for the knee, where the curve bends hard. At a knee you give up a little of one goal and receive a lot of the other. That exchange rate is almost always the trade you want.
A flat frontier means low stakes. Many configurations are near-equivalent. Your pick barely matters, and that itself is good news: it means the parameter region is wide and forgiving, which is what real edges look like.
A steep frontier means the trade-off is real. Every gain on one axis costs heavily on the other. Choose deliberately. There is no free lunch on a steep curve, and pretending otherwise does not flatten it.
Pairings that earn their keep
Sharpe against max drawdown, the highest-value single picture. Sharpe against trade count, which exposes tiny-sample brilliance. Return against out-of-sample return, which exposes fits directly. Sharpe against robustness, where robustness means how much performance changes when parameters get nudged; regions beat spikes. And for crypto, Sharpe against funding cost, which exposes strategies whose paper edge is quietly paid out as funding.
Why not just use a weighted score
The common shortcut blends the metrics into one number, 0.7 times Sharpe minus 0.3 times drawdown, and optimizes that. It feels rigorous. It is not. The weights are arbitrary, and once blended, the trade-off vanishes from sight. You cannot tell whether your winner sits at a knee or at a degenerate extreme. The blend destroyed exactly the information the decision needed.
The frontier refuses to decide for you. That refusal forces you to look, and the look is the entire value.
The workflow
- Pick two or three goals that matter. Usually Sharpe, drawdown, and one more.
- Run the study. Let it build the frontier.
- Find the knee.
- Pick at the knee. Not at an end.
- Then verify out-of-sample, stability, and trade count. A seat on the frontier is necessary, not sufficient. See out-of-sample testing.
How Edgecraft handles this
Edgecraft studies are multi-objective capable and recommended. Configure the goals once according to your trading targets, and the optimizer builds the full frontier instead of handing you one point. The results highlight trial points, and the agent can analyze the trials based on your criteria and offer the best ones with its reasoning written out. The reasoning is shown, not asserted, so you can disagree with it on the merits.
Continue learning
- Foundations
Optimization: what it is worth and when it hurts
What optimization can and cannot do, and how to avoid the data-mining trap that turns a fine strategy into a fragile one.
- Foundations
Statistical tools: what each metric tells you and what each hides
Sharpe, Sortino, Calmar, profit factor, win rate, expectancy, max drawdown — what each measures and what each conceals.
- Foundations
Out-of-sample testing: protecting yourself from luck
Splitting train and test, walk-forward, and why crypto needs longer windows than equities to mean anything.
Build your process around evidence
Join the Edgecraft waitlist and follow the development of a strategy intelligence platform built for realistic testing and deeper strategy analysis.
Educational content only. This article is not financial advice and does not guarantee any trading outcome. Trading involves risk.